


Product Giveaway in Gasoline Blending: What Measurement Uncertainty Really Costs
 Standard & Regulations
 Article
 Nicole Lock


Published: November 11, 2026
Gasoline blending profits depend on small quality differences that add up across large production volumes. When composition uncertainty is high, refiners and blenders apply larger safety margins. Those margins reduce the use of lower-cost constrained streams and increase the use of premium blending components.
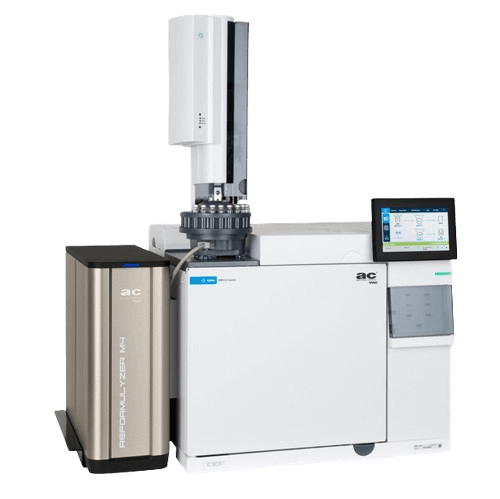
Even small differences in uncertainty can create measurable cost differences per barrel, which accumulate to significant annual impact. Reformulyzer M4 creates value by enabling more confident blending, allowing operations to stay closer to required quality targets without increasing the risk of exceeding specification limits.
Measurement Uncertainty Creates Product Giveaway
Gasoline blending is a continuous optimization process balancing product quality, regulatory compliance, and refinery economics. While octane is often the most visible specification, many blending decisions are constrained by compositional parameters such as aromatics, olefins, benzene, oxygen, and oxygenates. These limits often determine how much of a blendstock can be used in the final gasoline blend and ultimately influence the cost of every barrel produced.
In practice, refiners and independent blenders rarely blend directly to a specification limit. Instead, operational targets are set below the limit to account for measurement uncertainty and compliance risk. As analytical uncertainty increases, a larger safety margin is typically required, reducing how much of the specification limit can be used confidently for blending.
Although these differences may appear small, they can affect the use of lower-cost constrained blendstocks and increase reliance on premium balancing components.
Consider a refinery blending against an aromatics specification of 35 vol%. A blending target of 34.2 vol% versus 34.8 vol% represents only a 0.6 vol% difference, yet it can significantly change component selection and blend cost. In this scenario, the cost of uncertainty is not a laboratory cost, but a blending cost. Higher uncertainty leads to larger safety margins, reduced use of lower-cost constrained streams, increased use of premium components, and ultimately higher blend cost. The final gasoline remains fully compliant, but the refinery may be giving away value by producing a higher-quality blend than required. This unnecessary extra quality margin is what is commonly referred to as product giveaway.
Evidence: Not All Standard Methods Have the Same Precision
Differences in analytical precision directly affect the usable blending margin at the specification limit.
To evaluate analytical performance under practical laboratory conditions, PAC conducted a 2025 interlaboratory study (ILS) involving participating laboratories representing refining organizations, commercial laboratories, and industry stakeholders. Representative were analyzed and evaluated using accepted statistical practices for interlaboratory studies. The study demonstrated meaningful differences in repeatability and reproducibility for key gasoline composition parameters.
As shown in Table 1, reproducibility differences for key parameters such as aromatics and olefins are on the order of approximately 0.5–1.0 vol% between methods. In practice, part of this uncertainty is managed through operational safety margins, reducing the portion of the specification limit that can be utilized for blending.
Table 1: repeatability & reproducibility as reported by methods and samples run during the PAC 2025 ILS.
| Group | Concentration
(vol%) |
Repeatability (r) | Reproducibility (R) | ||||
| ISO22854 | 2025 ILS | EN 18015 | ISO22854 | 2025 ILS | EN 18015 | ||
| Aromatics | 30 | 0.48 | 0.40 | 0.73 | 1.49 | 0.99 | 1.86 |
| Olefins | 10 | 0.33 | 0.13 | 0.30 | 1.69 | 0.50 | 0.90 |
| Ethanol | 9 | 0.17 | 0.17 | 0.21 | 0.44 | 0.47 | 0.49 |
| ETBE | 9 | 0.05 | 0.06 | 0.33 | 0.19 | 0.35 | 0.67 |
| Oxygen | 3 | 0.09 | 0.05 | 0.07 | 0.19 | 0.13 | 0.17 |
| Benzene | 0.8 | 0.01 | Not included in current ILS | 0.01 | 0.03 | Not included in current ILS | 0.04 |
These are the same parameters that frequently act as blending constraints and influence refinery economics. The significance of these results extends beyond analytical performance metrics. Precision differences can directly affect blending decisions by influencing how much of the specification limit can be used with confidence.
Small Per-Barrel Effects Scale Quickly
Not all analytical methods provide the same level of repeatability and reproducibility.
From a refinery perspective, this distinction is important because method precision directly affects how closely operations can approach a specification limit. A method with larger reproducibility requires a larger operational buffer. A method with smaller reproducibility may allow refiners to reduce that buffer and use more of the allowable specification range. For active blending constraints such as aromatics and olefins, differences in reproducibility can approach approximately 0.5–1.0 vol%. While these numbers may appear small, they influence everyday blending decisions and component selection.
The result is that analytical precision becomes an economic variable rather than simply a laboratory performance metric. The financial impact does not require a large difference per barrel either. If measurement confidence allows part of the composition safety margin to be recovered, the cost savings can become significant over annual production. Below is an example of the cost per barrel using aromatics as an active blending .
Active constraint: aromatics (limit 35 vol%)
Example difference blending margin: ~0.3 vol%
Cause: larger reproducibility requires larger operational safety margin
This reduction in usable blending margin forces earlier reduction of FCC gasoline and increases the use of alkylate or similar premium blending components.
At a typical component value differential of € 6–10 per barrel, this may correspond to a blending cost impact of approximately:
👉 ≈ € 0.6–1.2 per m³ (≈ € 0.10–€ 0.20 per barrel)
Importantly, both blends remain fully compliant with the regulatory requirements of EN228 and octane specifications.
The difference lies entirely in how efficiently the allowable specification range is used.
What we see is small per barrel improvements become large annual value. One reason the economics of measurement confidence is often underestimated is that the savings per barrel appears relatively small. However, blending economics operates at refinery scale. Even conservative per barrel improvements can accumulate rapidly over annual production volumes. Table 2 illustrates the order of magnitude using conservative per-barrel savings assumptions.
Table 2: calculation of annual impact = per-barrel improvement × annual gasoline production
| Per-barrel blend cost improvement | 3 million bbl/year | 6 million bbl/year | 9 million bbl/year |
| € 0.05/bbl | € 150,000/year | € 300,000/year | € 450,000/year |
| € 0.10/bbl | € 300,000/year | € 600,000/year | € 900,000/year |
| € 0.15/bbl | € 450,000/year | € 900,000/year | € 1,350,000/year |
| € 0.20/bbl | € 600,000/year | € 1,200,000/year | € 1,800,000/year |
These figures are illustrative and will vary with local feedstock prices, refinery configuration, and market conditions. The principle, however, remains consistent: recovering even a small amount of lost blending margin can create significant recurring value.
Looking Beyond the Instrument Purchase
The investment case should not be seen only as the purchase of an analytical instrument. It should be viewed as a tool for protecting operational margins. Analytical technologies are often evaluated through a capital expenditure lens.
Questions typically focus on:
- Instrument cost
- Throughput
- Maintenance
- Staffing requirements
These considerations are important, but they represent only part of the business case. The larger question is often: What is the cost of blending conservatively because measurement confidence is insufficient?
The value of analytical confidence extends beyond the laboratory and can influence blend optimization decisions throughout the life of the system. The relationship between measurement capability and economic impact is illustrated below:
| Reformulyzer M4 enables | Operational effect | Economic effect |
| Lower uncertainty in group-type data | Smaller safety margin around composition limits | Reduced product give-away |
| Direct composition measurement | More confident use of lower-cost constrained streams | Lower average blend cost |
| One method for key gasoline composition parameters | Fewer assumptions caused by using multiple test methods | More robust decisions and fewer corrections |
| Recognized standard method for gasoline composition | Defensible data for lab, blending and compliance teams | Lower dispute, rework and compliance risk |
Reduced giveaway, improved utilization of lower-cost constrained streams, fewer blending adjustments, and greater confidence during compliance reviews can all contribute to operational value that extends beyond the laboratory. While the instrument investment is visible and one-time, the cost of conservative blending decisions can be less visible but recurring. Even small improvements in measurement confidence may therefore create significant value when applied across refinery-scale production volumes.
Conclusion
Gasoline blending margins are influenced by surprisingly small differences in composition control. When those differences are multiplied across refinery-scale production volumes, their financial impact becomes significant.
The relationship is straightforward:
Higher confidence in composition measurements allows operations to run closer to specification limits.
- Tighter operation reduces unnecessary safety margin.
- Reduced safety margin decreases product giveaway.
- Lower giveaway improves blending economics.
The Reformulyzer M4 supports refining operations by providing high-confidence gasoline composition data for blending decisions. For refiners and blenders operating in an increasingly constrained environment, the value of analytical confidence is not measured solely by laboratory performance. It is measured by how much of the allowable blending range can be used with confidence and the margin that can be protected as a result.
Related Resources

 Applications
 Article
Published: August 11, 2026 | Last Updated: October 15, 2026 Gasoline group type analysis helps refineries balance fuel quality, regulatory compliance, and blending costs. As...
Read More
Gas chromatography (GC) is a vital tool for separating and analyzing compounds that can be vaporized without decomposition.
Read More
Utilizing the AC SeNse detector when using gas chromatography for the analysis of ultra-low sulfur compounds in gaseous fuels is a robust solution, providing ultra-low...
Read More


