Store
Global Offices
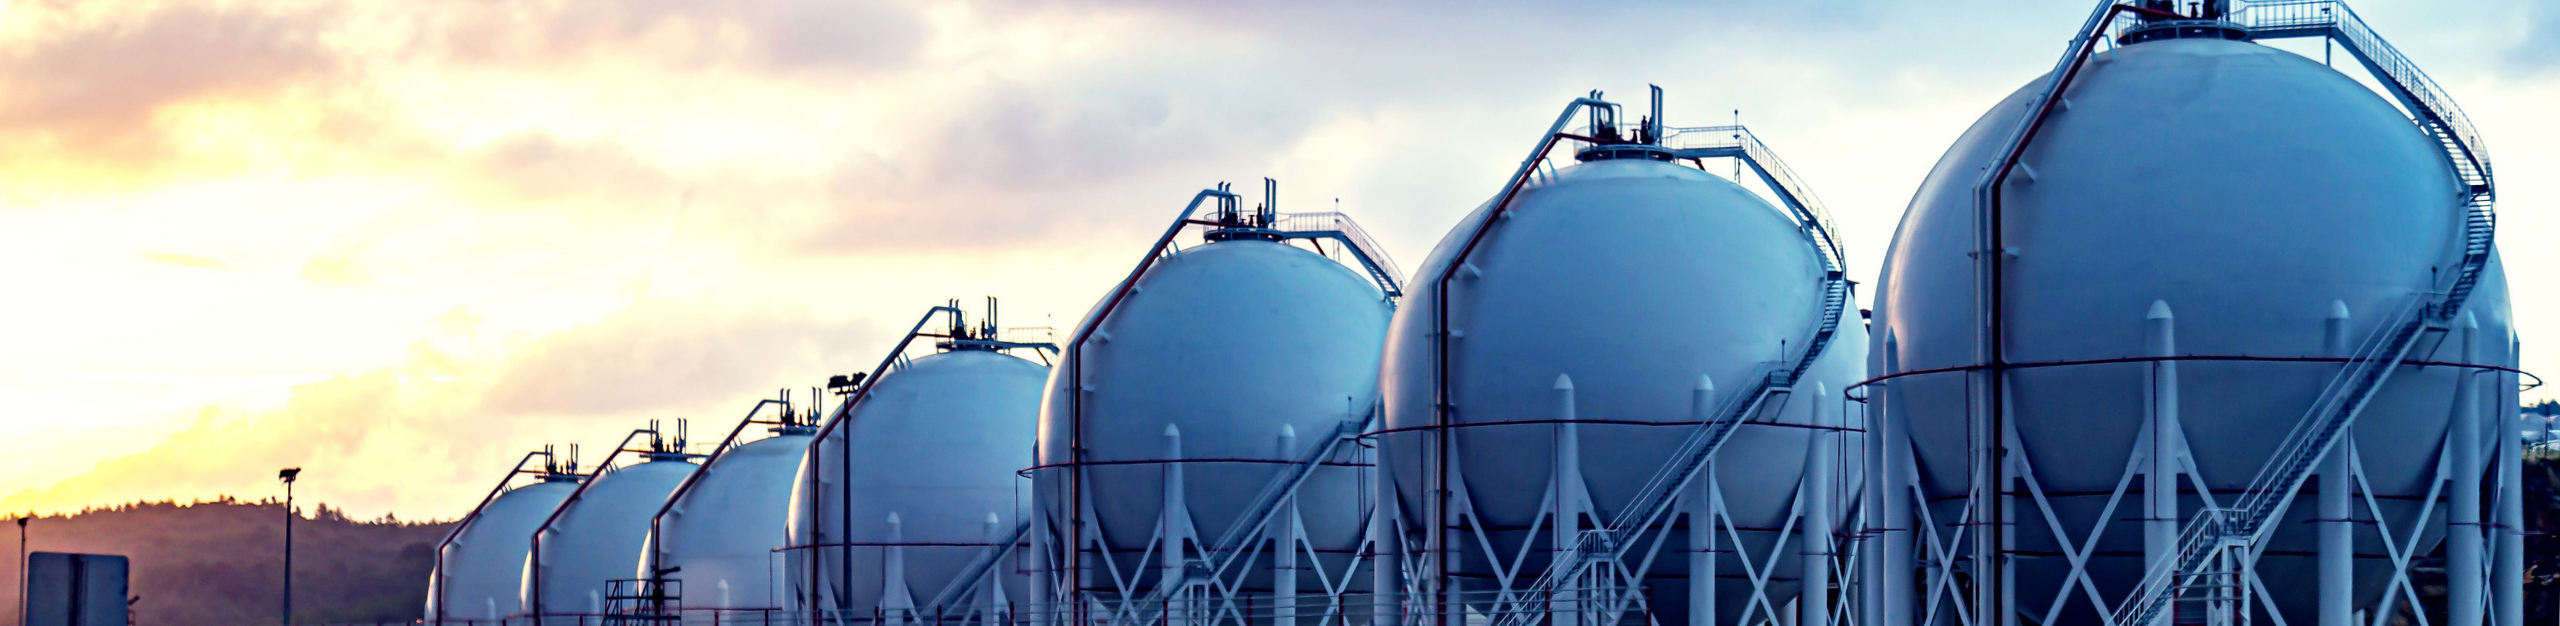
A row of large metal LNG tanks silhouetted against a vibrant sunset sky. LNG Analysis.

Liquefied Natural Gas (LNG) Analysis

From Wellhead to Burner Tip:

Analytical Confidence Across the LNG Value Chain

An LNG cargo handover is mainly driven by one value: the energy it contains.

Everything upstream of that number – feed gas composition, trace contaminants, speciated sulfur, the heating-value calculation and its uncertainty – is what makes it defensible. PAC builds the analytical solutions behind every step of it.

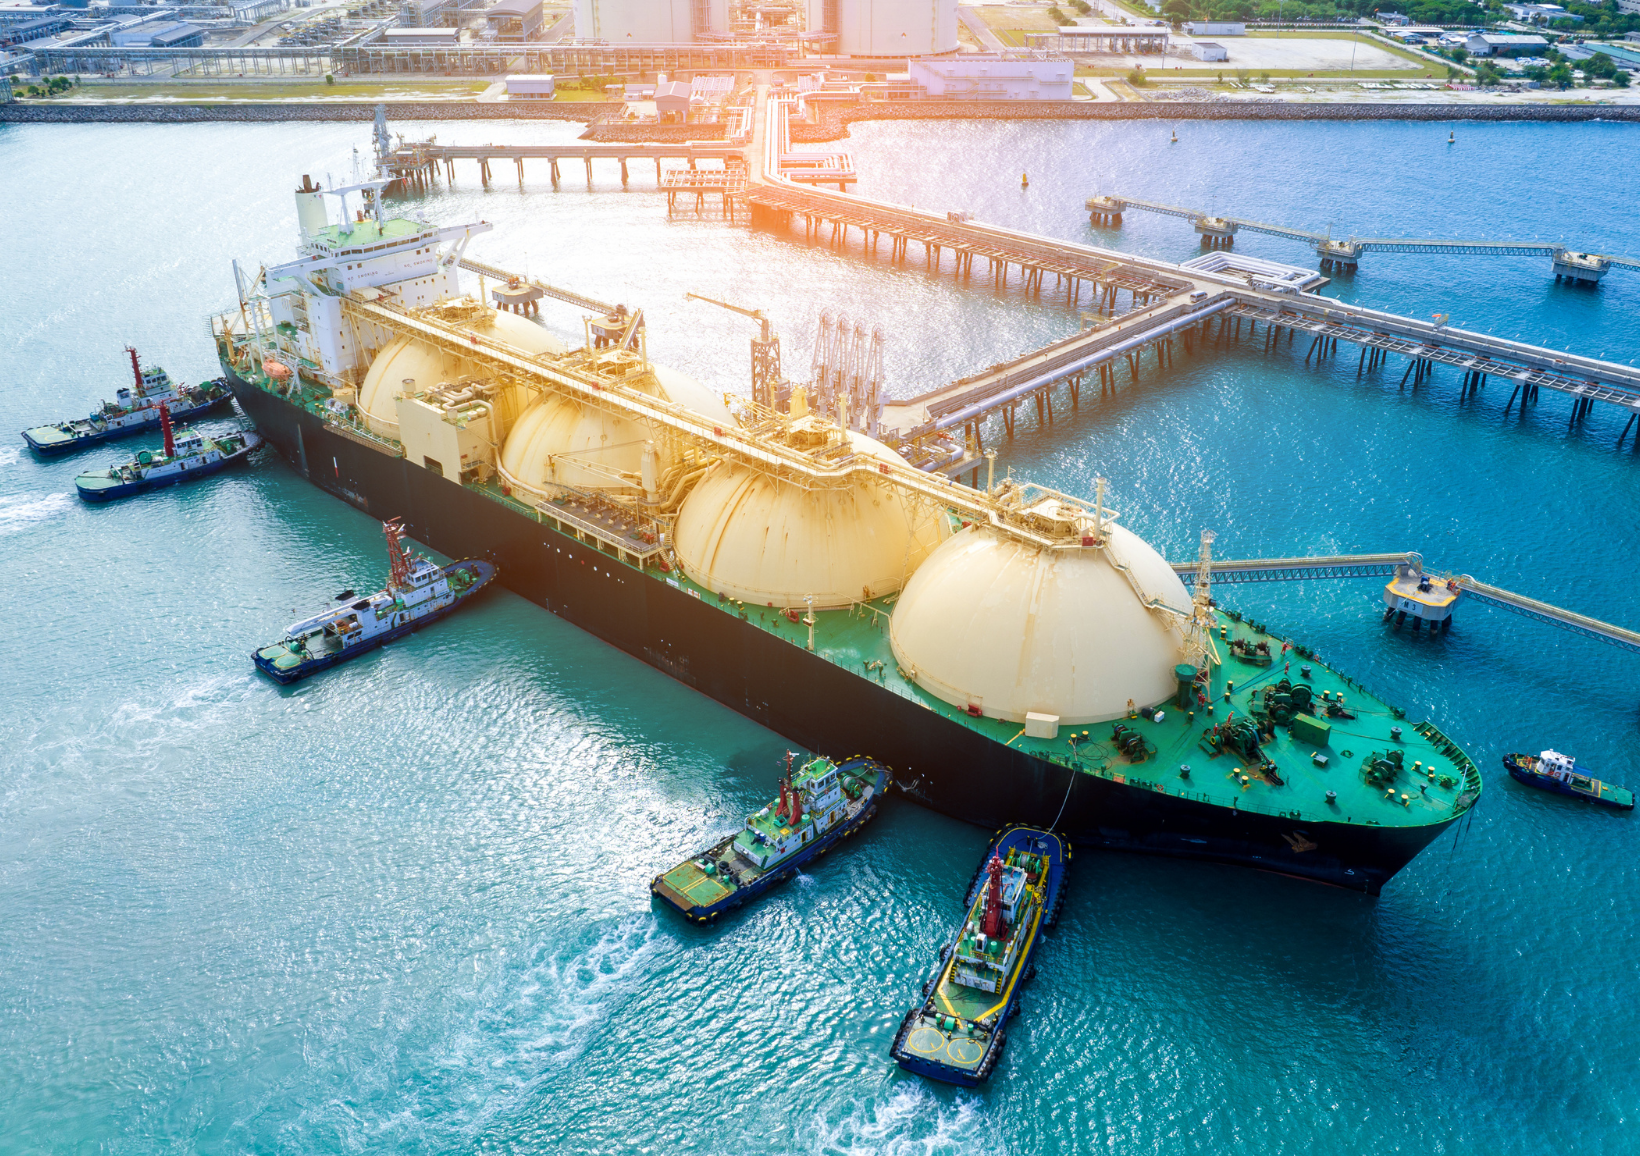
An LNG value chain tanker anchored in the water near a dock, with clear skies and calm waves surrounding it. LNG Analysis.

The Standards Behind LNG Quality

Natural gas is cooled to −162 °C, shrinking 600-fold in volume to become LNG. Its quality and value hinge on a handful of internationally recognized methods for composition measurement and heating-value calculation – ISO 6974, GPA 2261, GPA 2286 and GPA 2186 for chemical analysis, ISO 6976 and GPA 2172 for heating value calculations, and GPA 2145 for property basis in calculations.

Small differences in how precisely those measurements are made, and how rigorously their uncertainty is quantified, can move the value of a cargo.

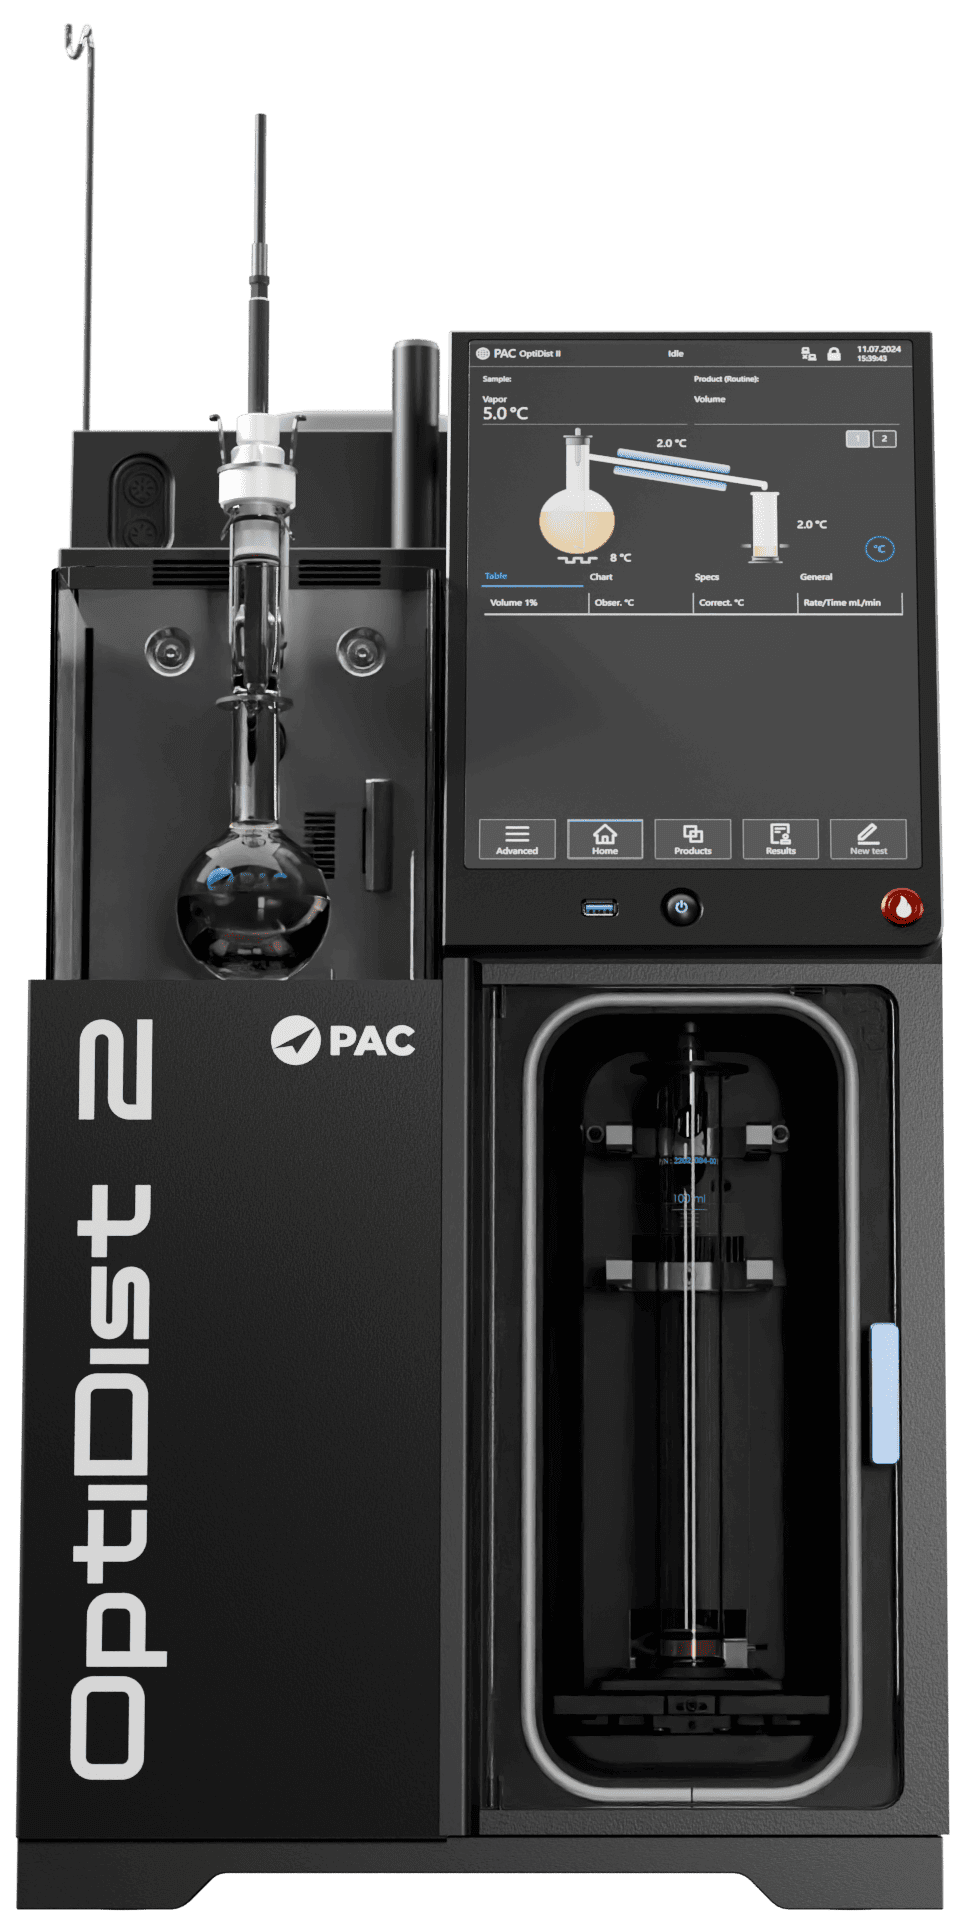
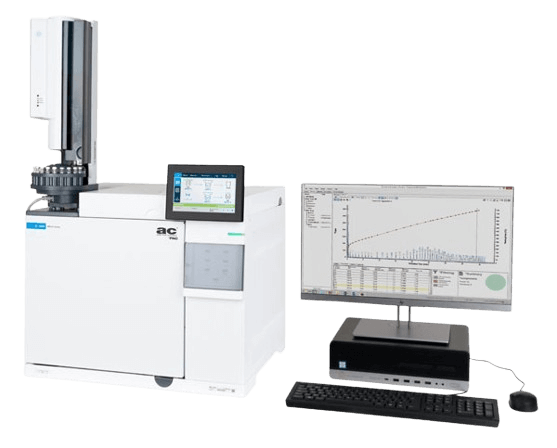
PAC’s custom GC and software solutions are built to run those methods consistently, cargo after cargo.

Explore PAC GC Solutions for LNG Analysis ⟶

What Makes LNG Different to Characterize

Unlike pipeline gas traded against a single domestic specification, LNG composition varies with the field it came from, the processing route it took, and the region that produced it – and every cargo is priced on the energy it contains. That makes contaminant levels and heating-value uncertainty a commercial question as much as a technical one.
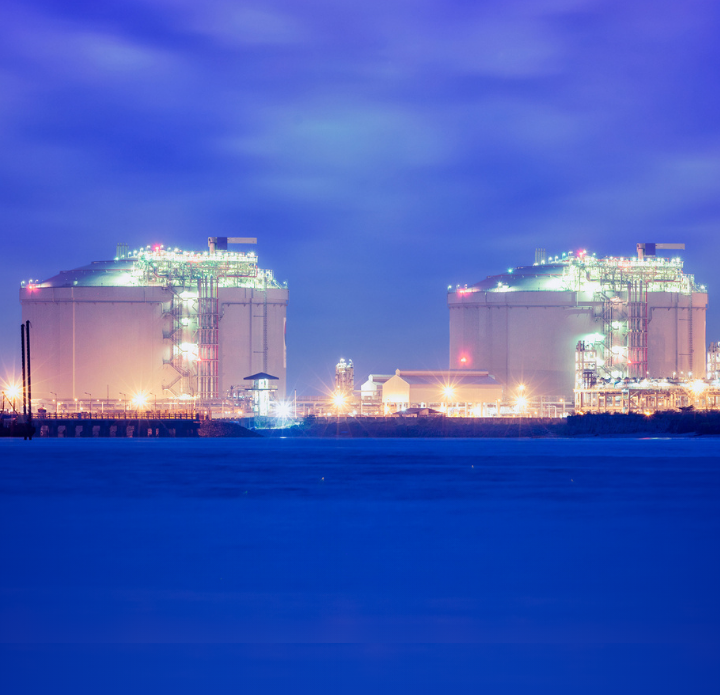
Two large oil refineries illuminated at night, showcasing numerous lights against a dark sky. LNG Analysis.

Feedstock Origin Changes What You Need to Measure

LNG composition shifts with where the gas comes from. Natural gas liquids and condensates (C2+) can be present in high enough concentrations to require dedicated condensate handling on site – effectively a small refinery – while sulfur content and lean-versus-rich characteristics vary by source and region. Those differences drive real changes to the analytical setup a project needs.
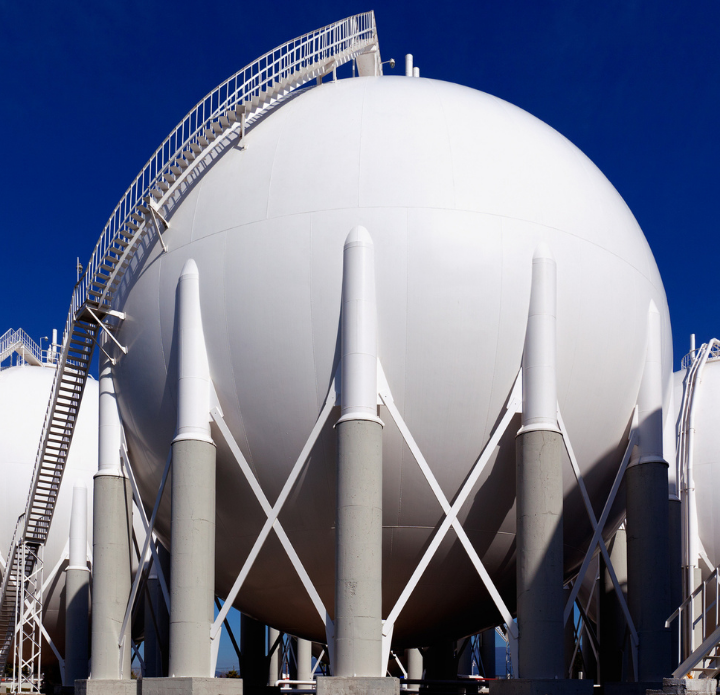
Large white storage tanks with a ladder on top, set against a clear blue sky. LNG Analysis.

Cargo Quality Is Set by More Than One Number

Total sulfur, H₂S, nitrogen, methane and higher-hydrocarbon content, and density are all parameters LNG buyers watch closely – trace contaminants at one end of that range, bulk composition at the other. This is why PAC's portfolio spans the full range and delivers one consistent picture of LNG quality.

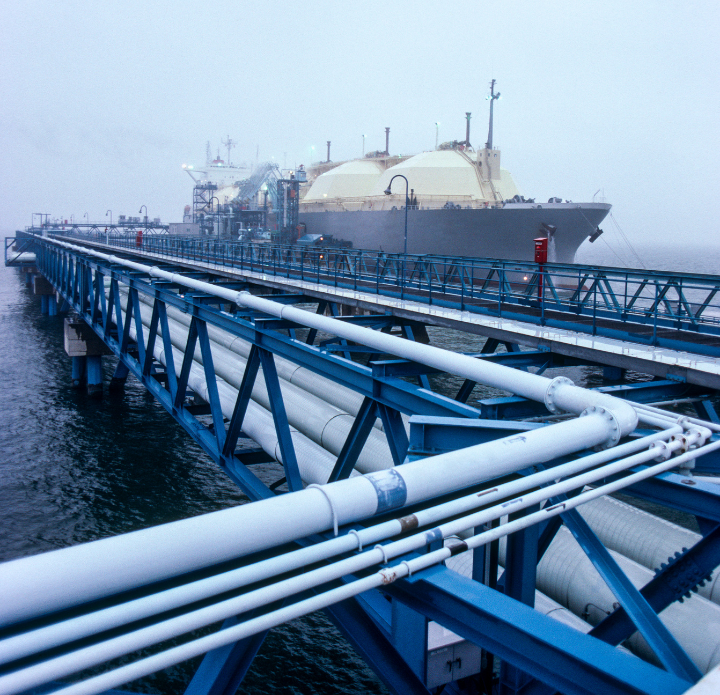
A large LNG ship rests at a pier, surrounded by water and with cargo containers stacked nearby. LNG Analysis.

Heating-Value Uncertainty Carries Real Financial Weight

Heating value is calculated from chemical composition, and LNG cargoes are valued on heating value – so measurement uncertainty has a direct commercial impact. High precision and accuracy in PAC's equipment together with their uncertainty-of-heating-value software give technical and commercial stakeholders defensible numbers to capture the full value of their cargo.

What Matters at Each Stage of the LNG Value Chain

From wellhead to burner tip, the LNG value chain can be segmented into seven stages – plus a floating configuration (FLNG) that compresses four of them onto a single vessel. Each stage calls for a different analytical measurement.

LNG Value Chain Table
Stage
What Matters

1. Exploration and Production

Raw gas composition varies by basin, by well, and over time – methane, C2–C6+, acid gases (CO2, H2S), nitrogen, water, and condensates. Feed characterization is the starting point for plant design and operation. NGLs and condensates are revenue streams in their own right and need dedicated compositional characterization.

2. Gas Treatment

Contaminants are stripped to parts-per-million and parts-per-billion levels. Total and speciated sulfur analysis identifies which compounds need attention.

3. Liquefaction

Composition entering the cold box defines the final product: methane content, nitrogen, and sulfur limits. Full composition and trace verification certify the product before storage.

4. Storage and Loading

LNG does not stay the same in transit. Boil-off is selective – nitrogen and methane leave first, so stored LNG “weathers” and its heating value drifts upward over time. Loading requires both quantity gauging and representative composition sampling to capture the full value of the cargo.

5. Shipping and Custody Transfer

Custody of the energy transfers on volume, density, and calorific value. This is the point where money changes hands, and where quantified uncertainty matters most.

6. Regasification

Receiving terminals must match strict national-grid Wobbe Index and GCV bands. Weathered cargoes may need blending – nitrogen dilution or LPG enrichment – before send-out.

7. End Use

Power turbines, industrial burners, and petrochemical or hydrogen feedstock users each have different sensitivities, from rapid Wobbe swings to trace impurities. LNG as a marine fuel adds methane number and methane-slip measurement under emerging regulation.

FLNG (Floating LNG) Vessels

Compresses production, treatment, liquefaction, storage, and offloading onto a single vessel for remote, stranded gas fields – where analytics must be compact, robust, and remotely supportable.

A large industrial refinery with towering smokestacks and complex machinery against a clear blue sky. LNG VAnalysis.

PAC Solutions for LNG Analysis

White image of a bold, simplistic lightning bolt icon. The design conveys energy and power with a clean, modern aesthetic.

Compositional and Trace Analysis

GC platforms for compositional and extended compositional analysis, including custom high-pressure configurations for wellhead NGL and condensate samples, and for trace analysis.

Simple line art depiction of the atomic structure with a nucleus and 3 orbiting electrons.

Elemental Analysis


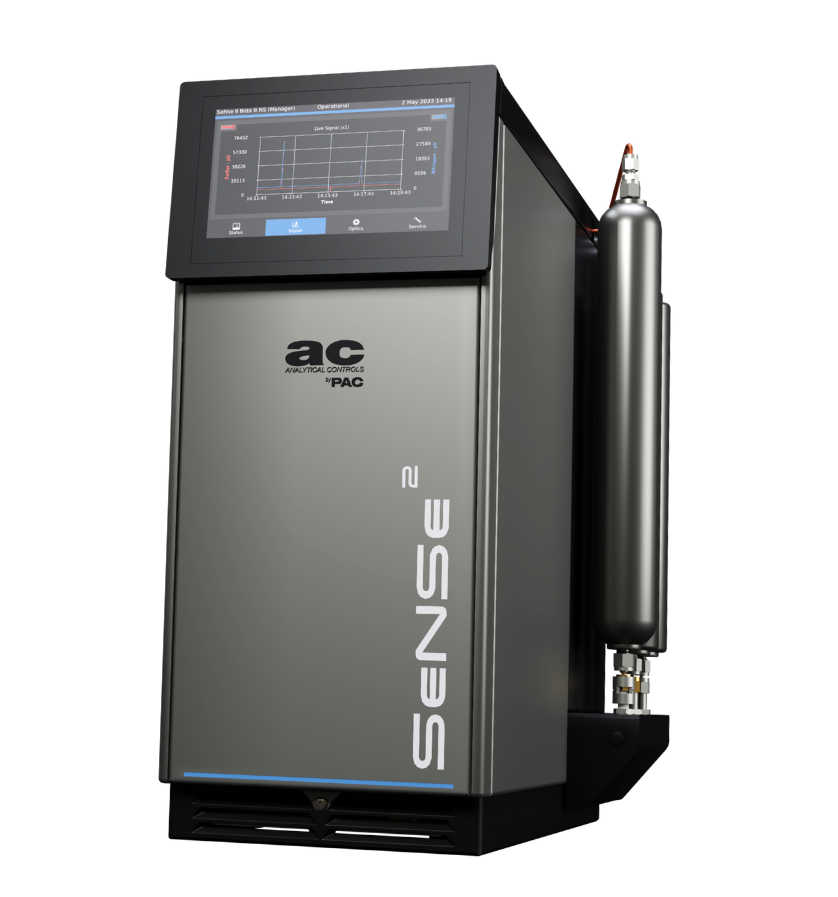
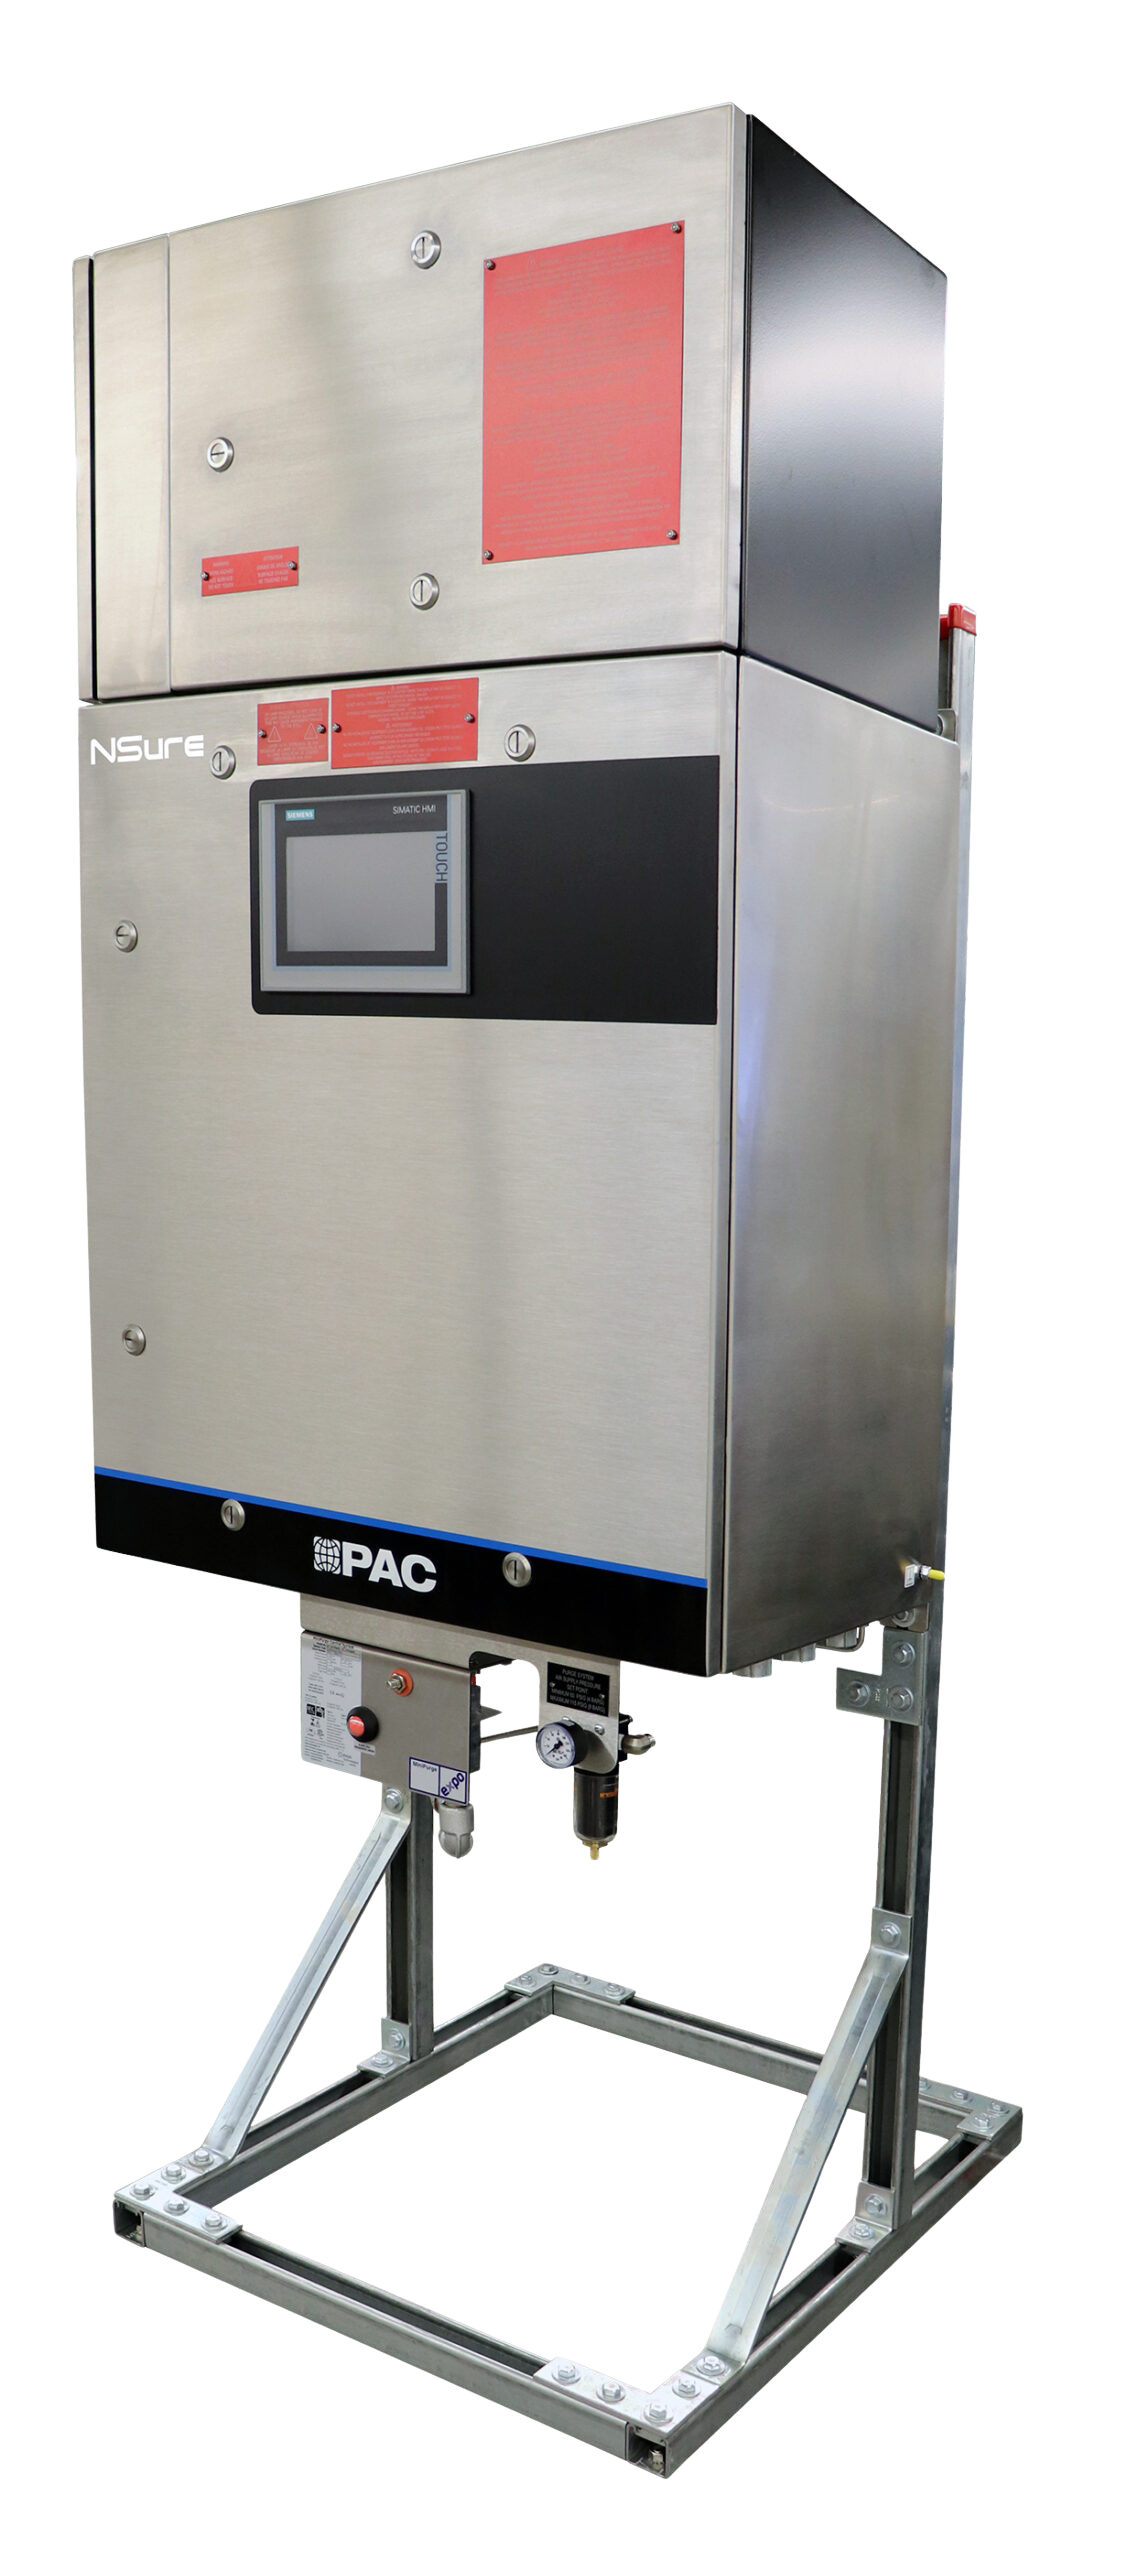
ElemeNtS for total sulfur; SeNSe² (SCD/NCD) for speciated sulfur and nitrogen at parts-per-billion levels.

White shield with checkmark icon against a transparent background.

Heating Value and Uncertainty Software

IRIS application software calculates GCV, density, and Wobbe Index from measured composition, with uncertainty evaluation – maximum permissible error and bias – built into the same workflow.

Aerial view of a large LNG tanker navigating through the open ocean, surrounded by deep blue water. LNG Analysis.

The Same Toolbox, Applied to Adjacent Gaseous Fuels

The methods PAC provides for LNG characterization – speciated and total sulfur analysis to ASTM D5504, ISO 20729, and related standards – are the same ones referenced in adjacent applications: biomethane, compressed biogas, and LNG as a marine fuel, where methane number and methane slip are increasingly tied to regulatory and commercial requirements.

Customers moving into those markets can rely on the expertise and instruments PAC readily provides.

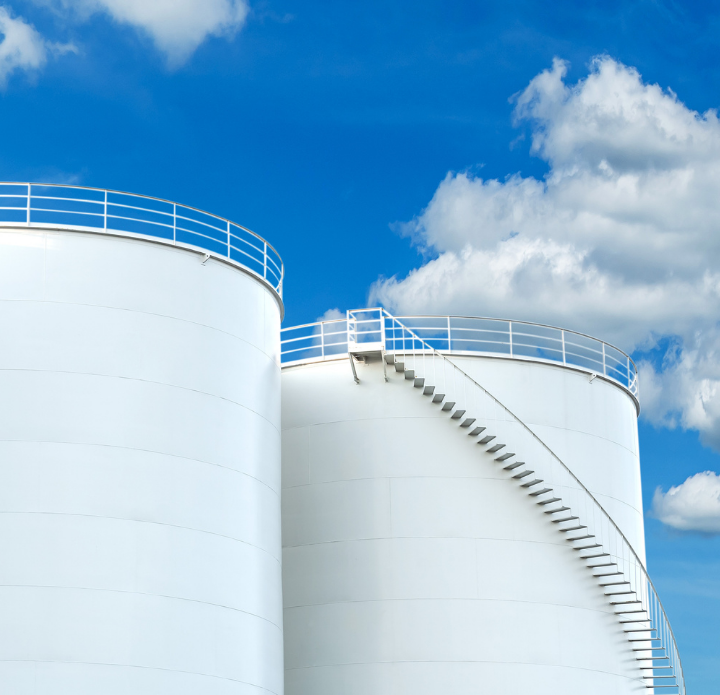
Two large white LNG tanks with a ladder on top, positioned side by side in an industrial setting. LNG Analysis.

LNG as a Transition Fuel

LNG remains a fossil-based fuel, but it can offer a lower-carbon alternative to higher-emission fuels in power generation, industry, transport, and marine applications – reliable energy with a reduced CO₂ footprint to bridge today's needs while cleaner fuel ecosystems scale.

Substantiating that is a measurement problem. Across the value chain, CO₂ and other impurities have to be measured before they can be separated, monitored, or captured for use in e-fuels and e-chemicals – and in marine LNG, methane slip is moving from an operational concern to a reported, regulated figure. The instruments that characterize LNG quality are the same ones that substantiate its emissions profile.

Looking beyond LNG as a fuel?

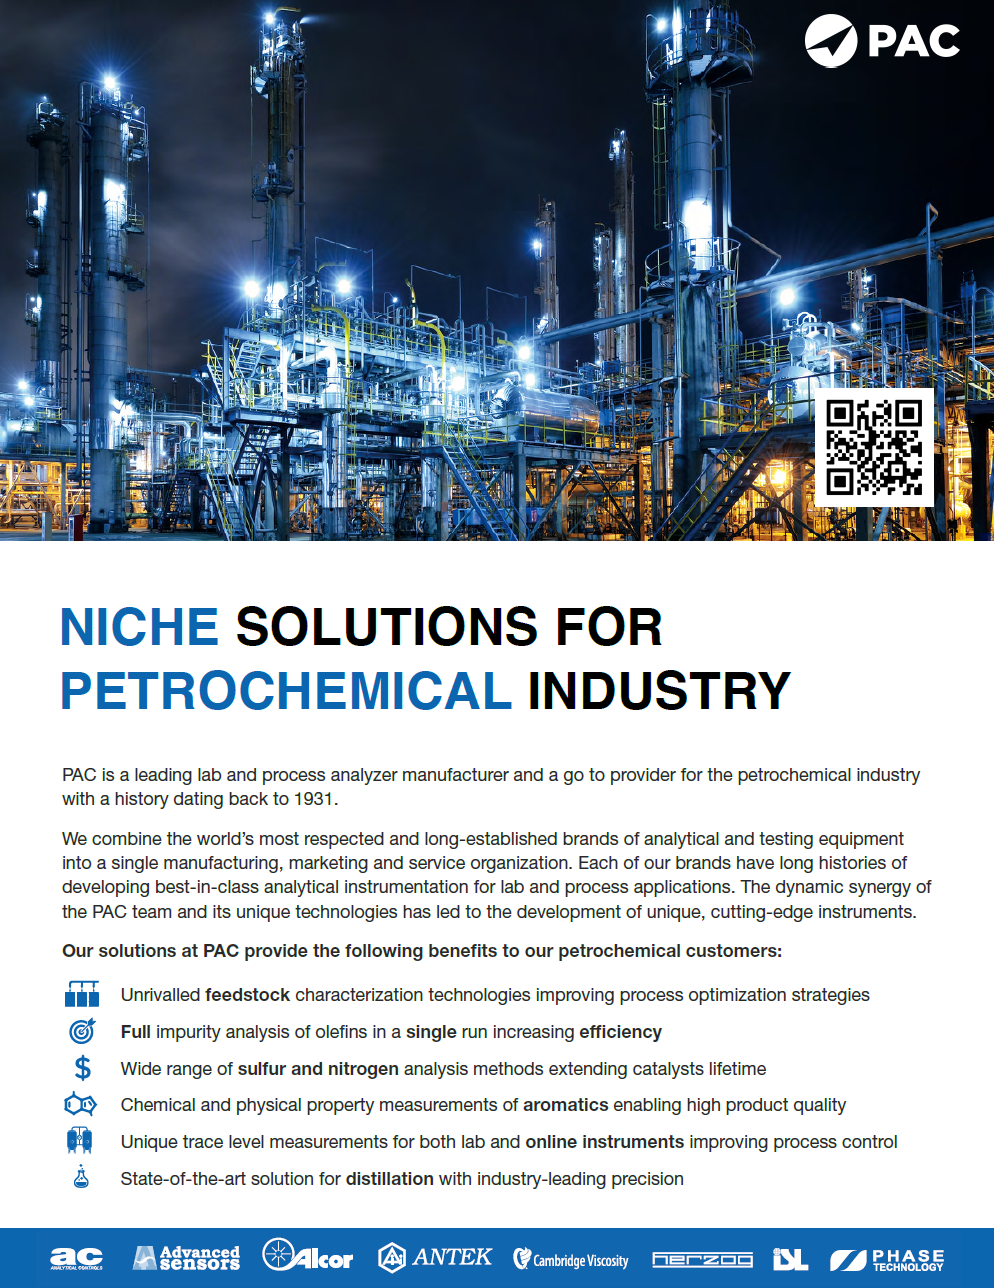
Most LNG is used for heating and power, but it also serves as a feedstock for petrochemical manufacturing in mixed-feed steam crackers. PAC’s complementary petrochemical solutions portfolio covers the full range of upstream, midstream, and downstream testing needs.

Download the Petchem Brochure

Download the Petchem Brochure

Industrial complex at night with bright lights and numerous towers. Text below reads

Explore PAC's LNG Value Chain Solutions

Find Your LNG Solution

Subscribe to Newsletter
I confirm that I have read and understood the Privacy Policy and consent to its terms.

img img img img check